Lingtypology – the package for linguistic mapping and typology – is four years old.

Linguists started to mark language features on the map a long time ago. The first linguistic maps were created by dialectologists at the end of the 19th century, and in the course of the 20th century, dialectal atlases were created for a number of major languages. When linguistic typology flourished in the 1980s, it became necessary to create maps that would show the distribution of linguistic phenomena across large samples of unrelated languages. The World Atlas of Language Structures, first published as a book and later as an online database, is the most large-scale project of this type.
Despite the demand, until four years ago there was no simple tool for linguists to mark a set of points on a map with different colors. A point corresponded to a language, and its color corresponded to a linguistic feature of the language. This is not to say that there were no tools at all, but they were often heavy and demanded a lot of effort from the researcher. This inspired George Moroz, of HSE’s Linguistic Convergence Laboratory and School of Linguistics, to create a new software product that turned out to be very popular: lingtypology. Lingtypology is an open source package for R, designed to create maps for linguistic typology. Since the package was published on CRAN on 29 December 2016, it was downloaded 25,000 times (the package was first published Github on 12 June 2016, but the number of downloads from Github are not included here).
George Moroz talks about the package
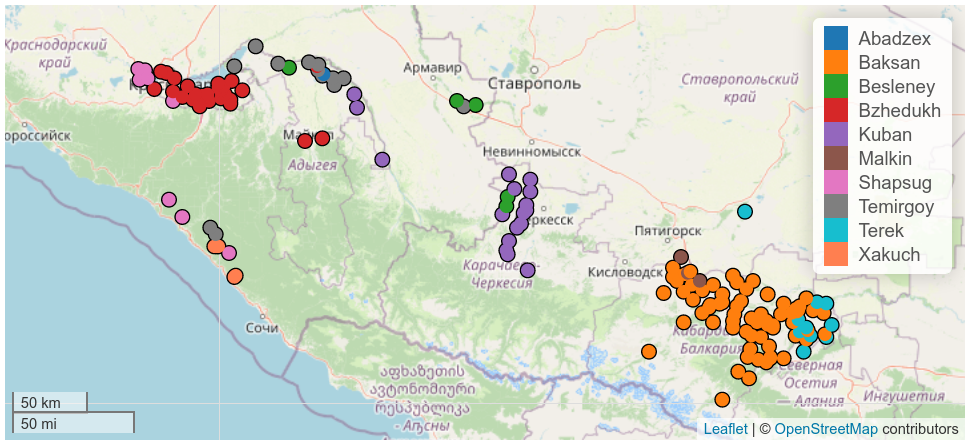
When this tool appeared, creating maps became a matter of one line of code. This opened up new horizons: as with any visualization, linguistic maps were often used as a tool to illustrate an idea. Now maps have become a research tool, that allows the visualization of different linguistic variables. The map below, for example, shows the distribution of Circassian dialects in Russia. If a researcher wants to investigate a feature based on a representative sample with different dialects, they can use a map to choose maximally distant settlements from each dialect group.

Another function of the package that many linguists are not aware of yet, is that it provides access to linguistic databases. Currently lingtypology supports eight databases, created by international collectives of linguists. The most widely known ones are Glottolog, WALS, AUTOTYP, PHOIBLE and Affix Borrowing database. With lingtypology researchers can download data from these sources with a single command and combine these data with their own to visualize the relationships between different data sets. In the future I plan to expand the list of databases that can be accessed via lingtypology.

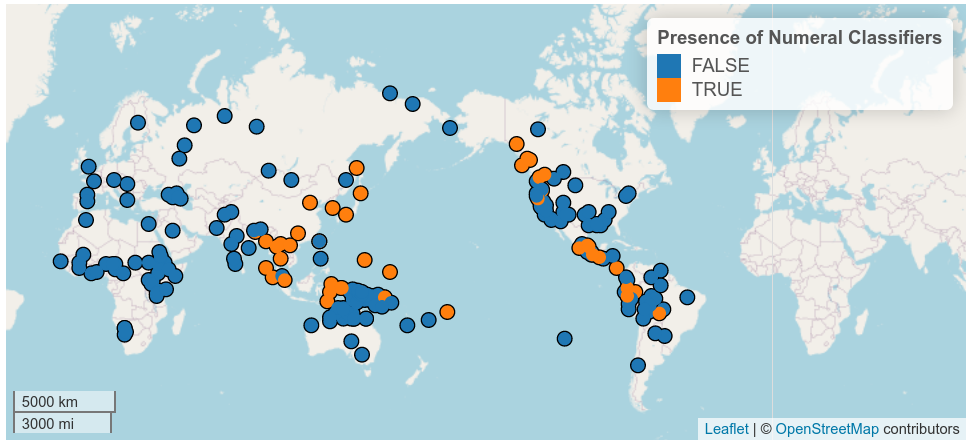
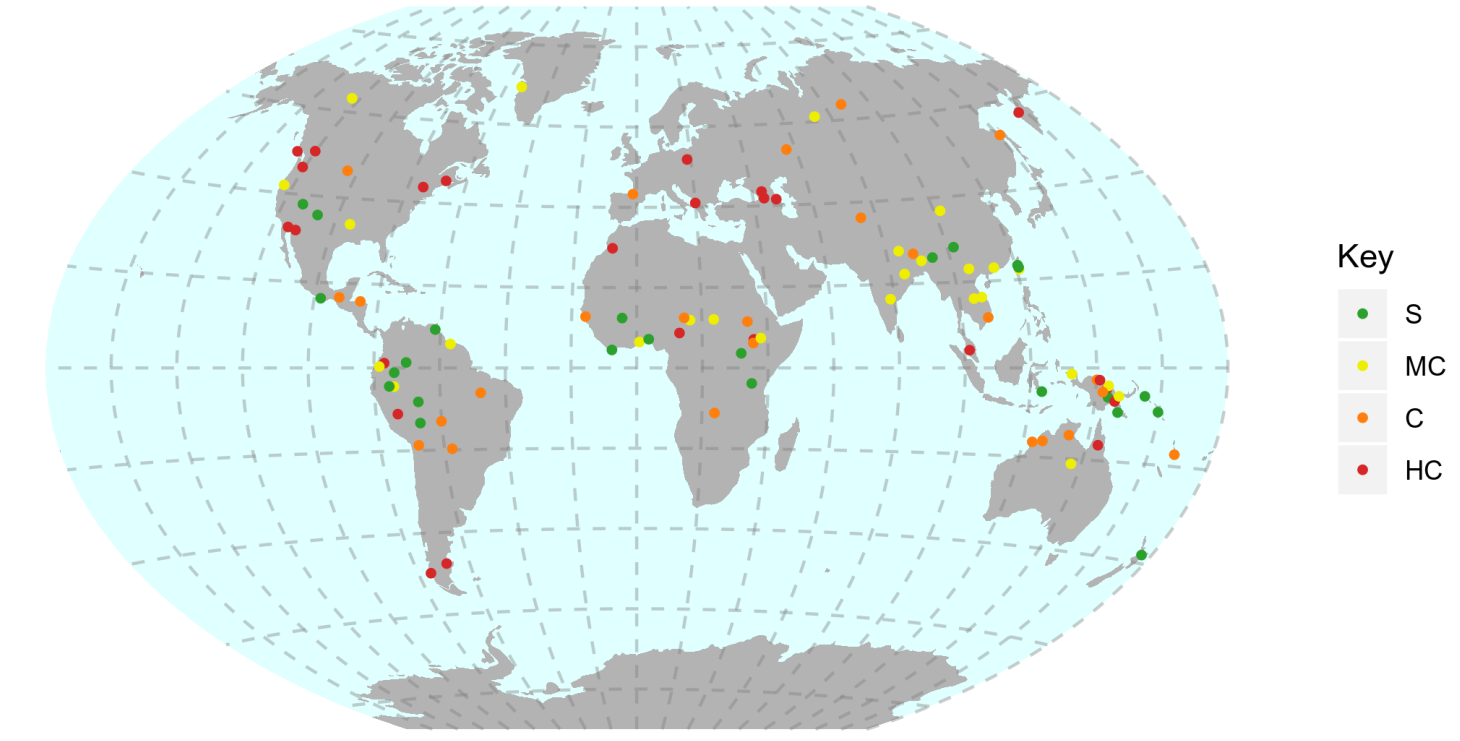
An important feature of the resulting maps, is that they are based on the JavaScript library from Leaflet, which creates interactive maps, allowing the user to zoom in and out. Researchers can use them to create dynamic websites (see, for example, The World Consonant Alternation Database) without the risk of showing too much data at once: the user can zoom in to look at details that are not visible at first glance. There is, however, a significant downside to this feature. Many journals require high resolution images, and the interactive maps generated by lingtypology often do not meet this requirement. Because of this, I plan to create a static template for maps, like the one that was created for Shelece Easterday’s book “Highly complex syllable structure: A typological and diachronic study”:

I was able to develop this package first of all thanks to the people who created and maintain the Glottolog database: thanks to their efforts, in most cases users do not have to manually enter coordinates for the languages they want to visualize. Second, the ROpenSci community reviewed the package, which helped me to improve it. Third, my colleagues, friends, and students who used the package (not only for linguistics!) discovered mistakes and came up with new features. One student of the School of Linguistics, Mikhail Voronov, wrote an equivalent package for Python. Fourth, the concept of Open Source helped me to receive feedback and support from different linguists from around the world after I wrote about the package on the LINGUIST List mailing list.